
Who changed what, and when
Every change to projects, expenses, budgets, stock, users and sign-ins is logged with who and when. Written in the same database transaction as the change.
How long the log is kept is configurable.
Product
Project and operations software for desalination and water treatment teams. Everything on this page is in the current release (v3.2). Screens show demo data.
Priced per plant, not per user.
Core difference
Stock issued from the warehouse is charged to the project that used it, so you see material cost per project across your whole portfolio.
Covers material cost from stock issued, not every project cost. Cost views are for Admin and Engineer roles. Costs update when a stock movement is recorded.
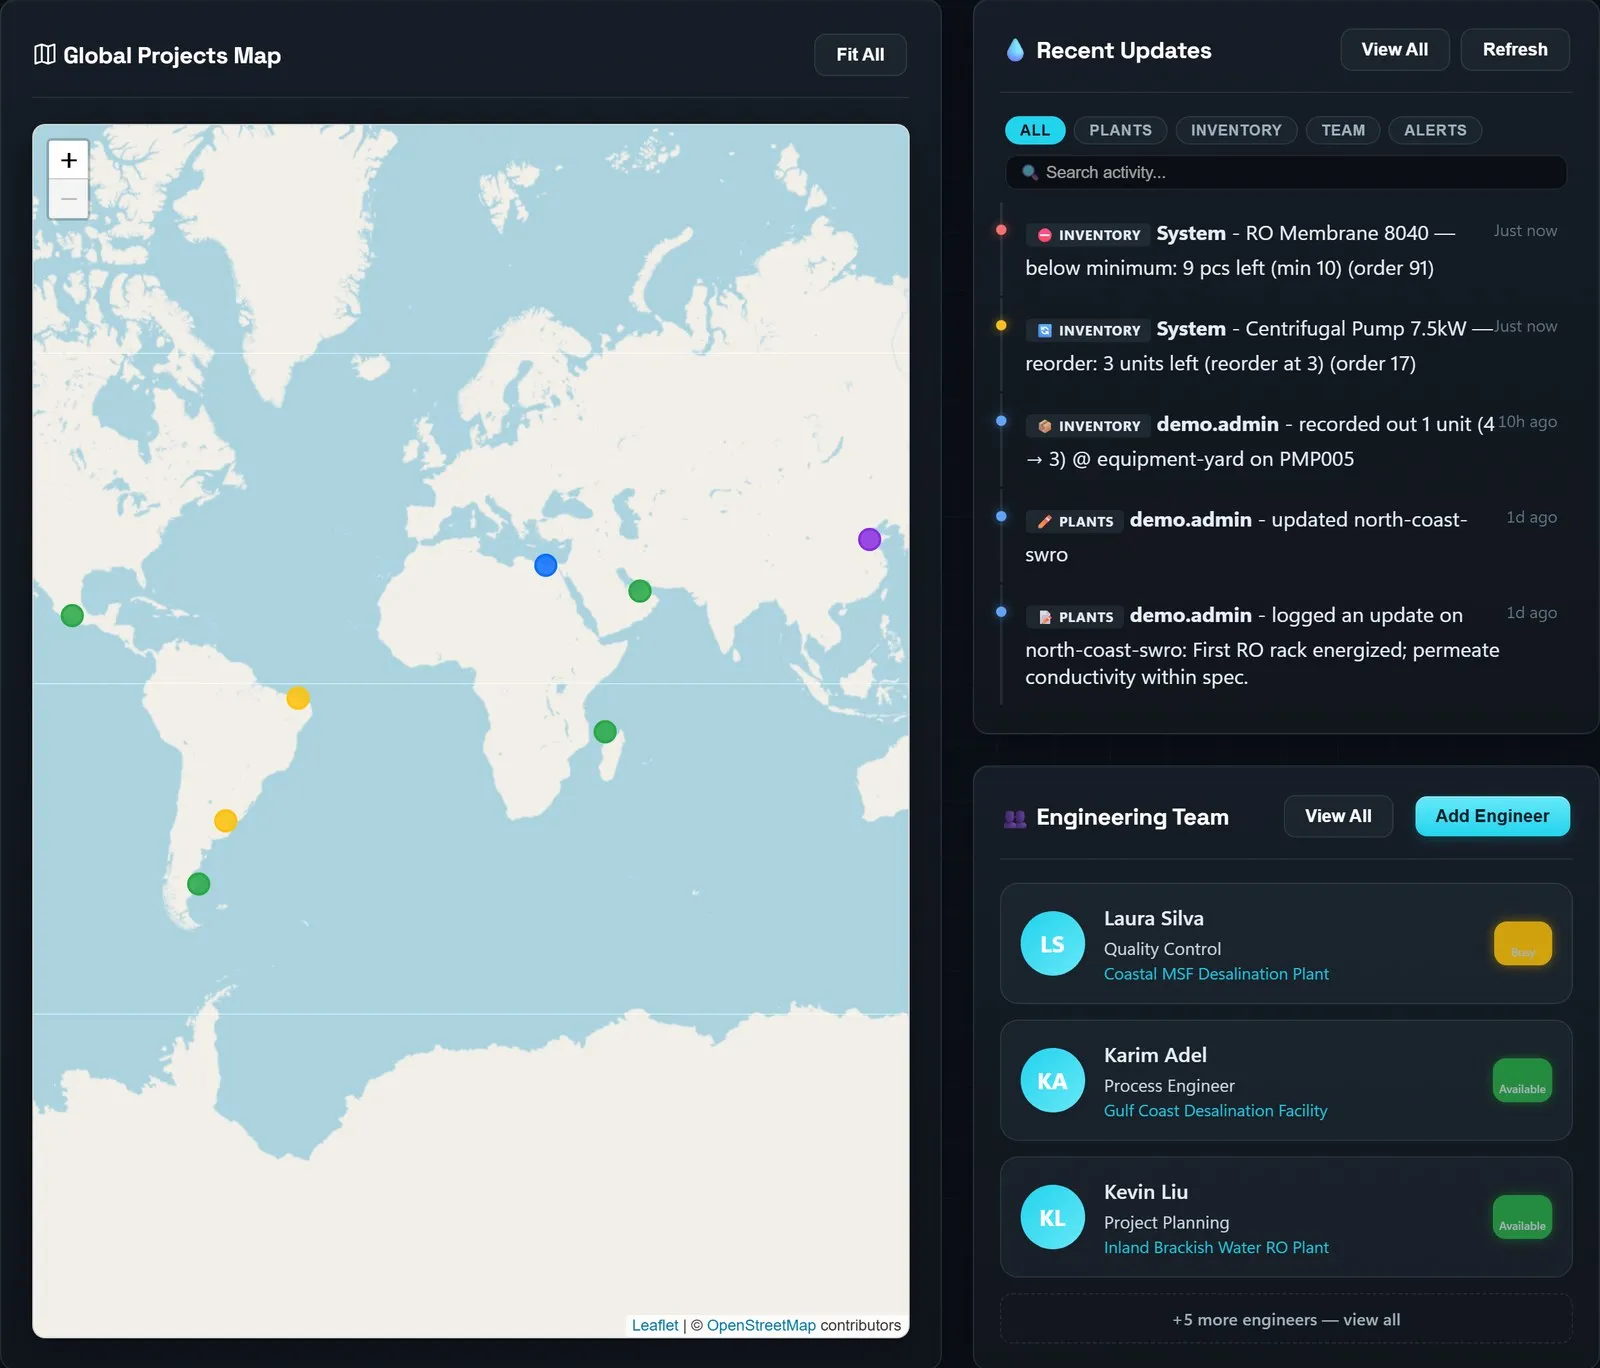
Every plant on one map, with status, capacity (thousand m³/day), progress, energy use (SEC) and lead engineer.
Capacity is entered data, not live metering.
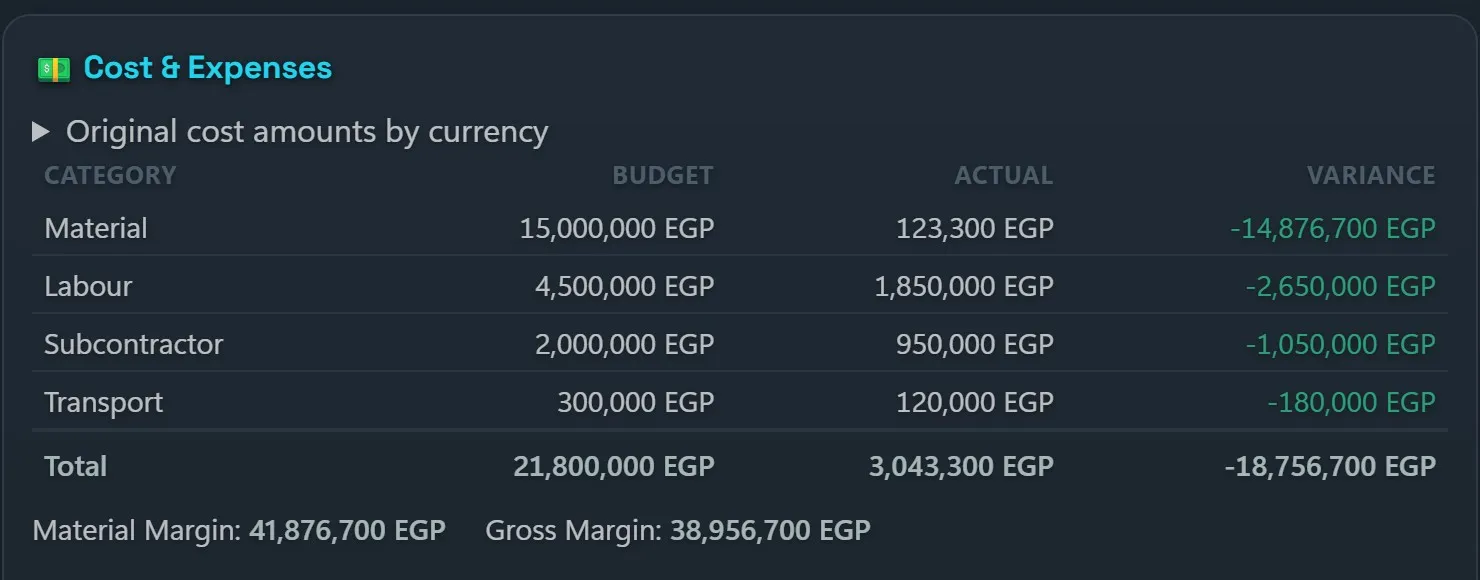
Expenses by category against budget, with over-budget signals per project.
Budgets and expenses in EGP, USD, SAR, AED or EUR, converted with dated exchange rates.
Not accounting software. No invoices or purchase orders. Exchange rates are entered with a date, not pulled from a live feed.
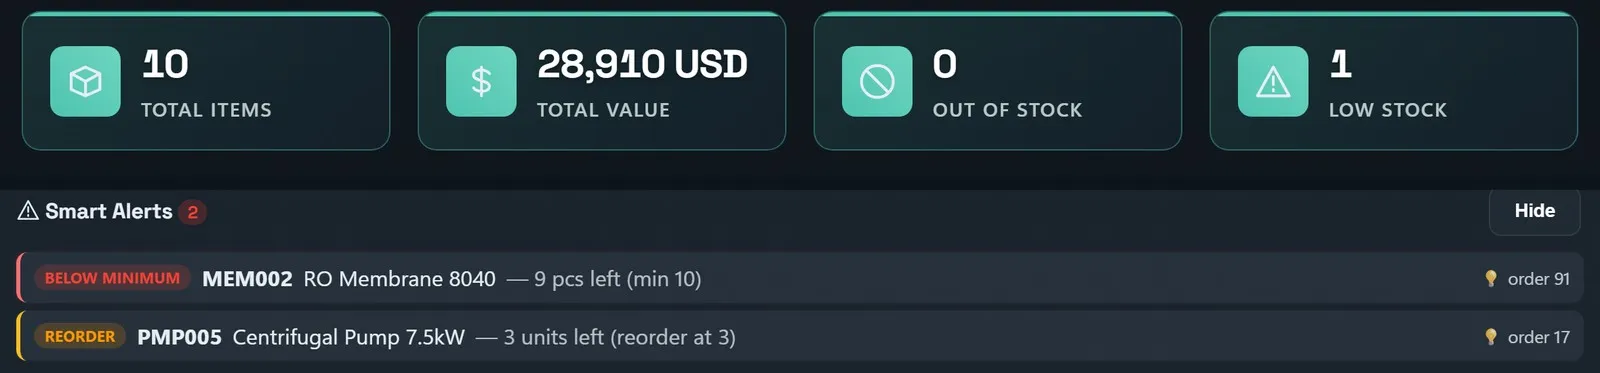
Stock in, out, transfers and adjustments across warehouses, charged to projects.
Alerts at reorder point, at minimum level, and for batches that are expired or expire within 30 days.
Alerts appear in the app. No email or SMS alerts. No procurement or supplier ordering.
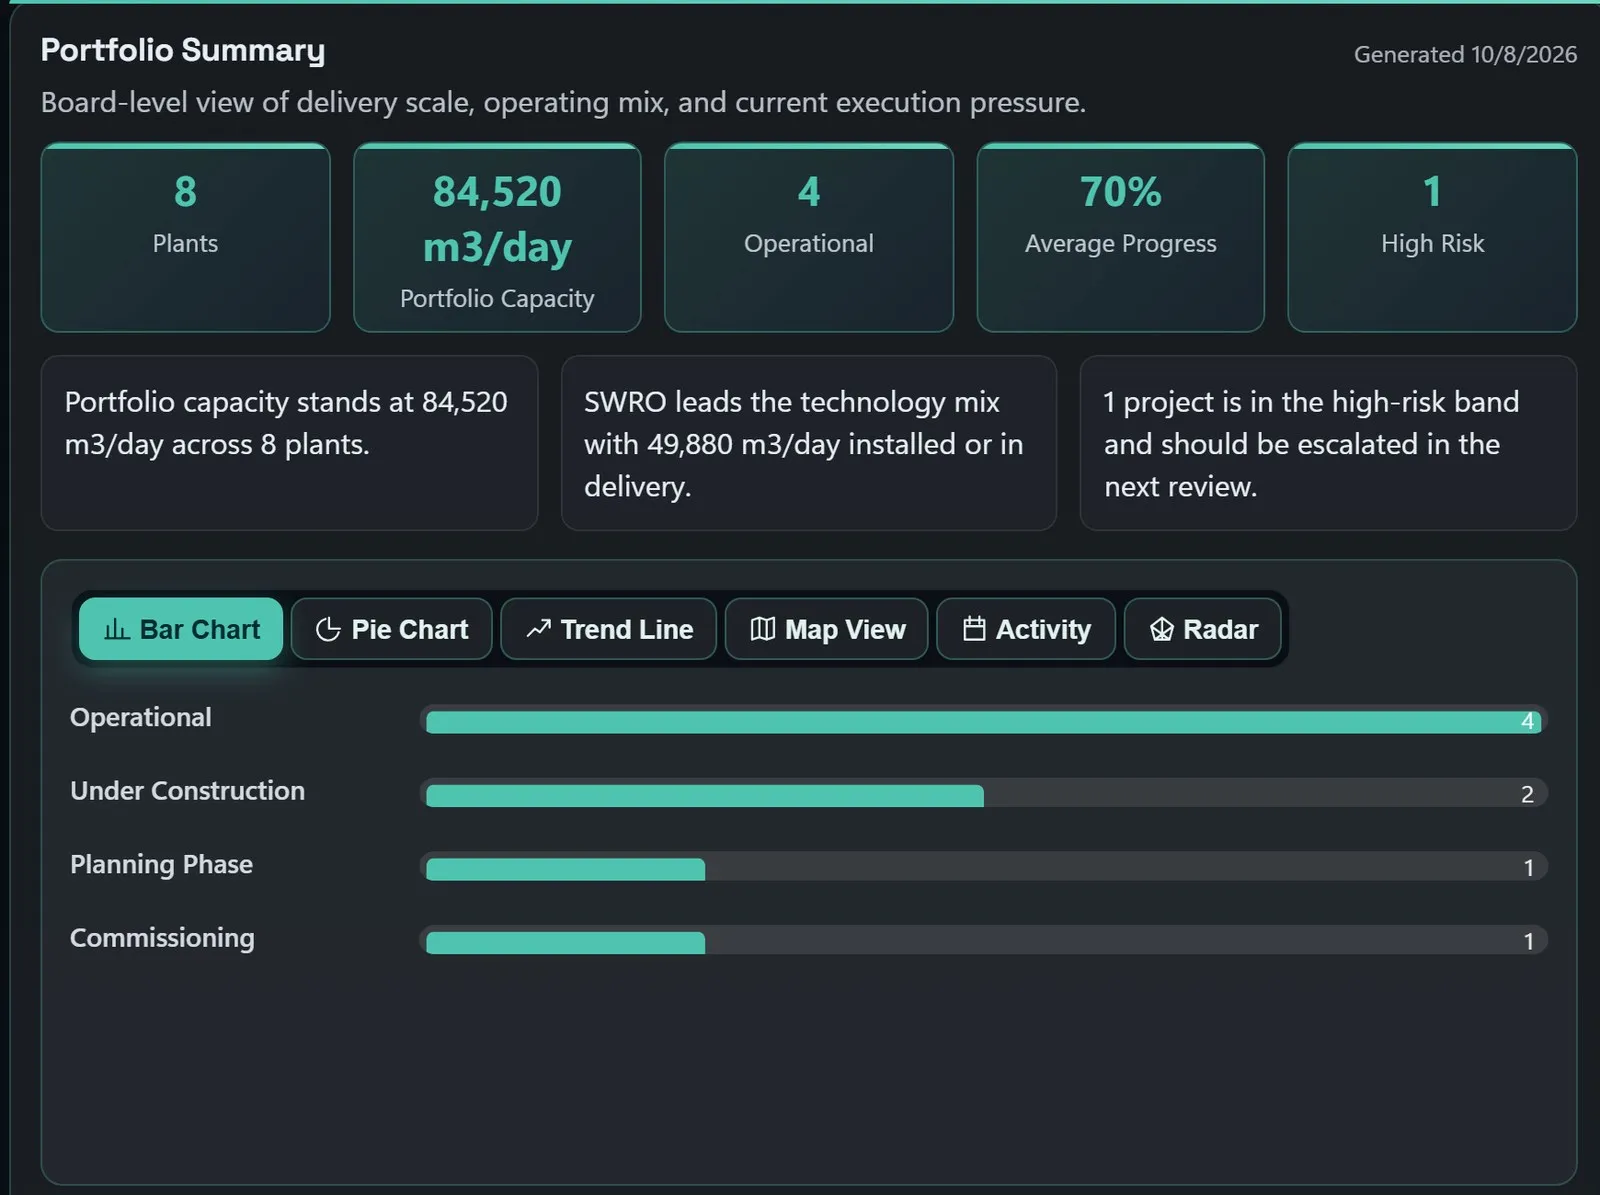
Portfolio summary, status breakdown, capacity by technology, energy (SEC) trends, engineer workload, financial analysis, project timeline, geographic distribution, performance metrics, maintenance schedule, risk assessment, environmental impact.
Export reports to PDF, Excel or CSV.
Reports run on demand. There are no scheduled or emailed reports.
Every change to projects, expenses, budgets, stock, users and sign-ins is logged with who and when. Written in the same database transaction as the change.
How long the log is kept is configurable.
Three roles: Admin, Engineer and Viewer.
Contract values and stock unit prices are hidden from the Viewer role, enforced on the server. Viewers also don't see who made each stock movement.
Runs in the browser on modern phones and tablets and can be installed to the home screen like an app (PWA). No app store needed.
Needs an internet connection to save changes. Offline you only get the app shell and the last non-financial snapshot.
A dedicated instance per client, in Docker with HTTPS, hosted for you or on your own servers. Company sign-in through LDAP / Active Directory.
A walkthrough focused on your sites.